
 Cost of Living Tracker · June 2026
What it really costs to live in Australia right now
Rent, power, fuel, groceries and childcare have all moved since 2023. Here's where prices sit in June 2026 — pulled only from official Australian sources, with every figure linked back to its publisher.
Three things are doing most of the damage
Headline inflation has eased, but the everyday essentials are still climbing fastest. These are the biggest contributors to annual inflation in the year to April 2026.
Source: Australian Bureau of Statistics — Consumer Price Index, April 2026
Rent, capital city by capital city
Median weekly asking rents in the March 2026 quarter. Sydney is still the most expensive in the country; Adelaide and Melbourne the most affordable of the mainland capitals.
Renters are stretched to a record. Households are now putting an estimated 33.1% of gross income toward rent — the highest share on record — with national rents up 5.7% over the year.
Sources: Domain Rental Report, March 2026 quarter · Cotality Rental Review, Q1 2026
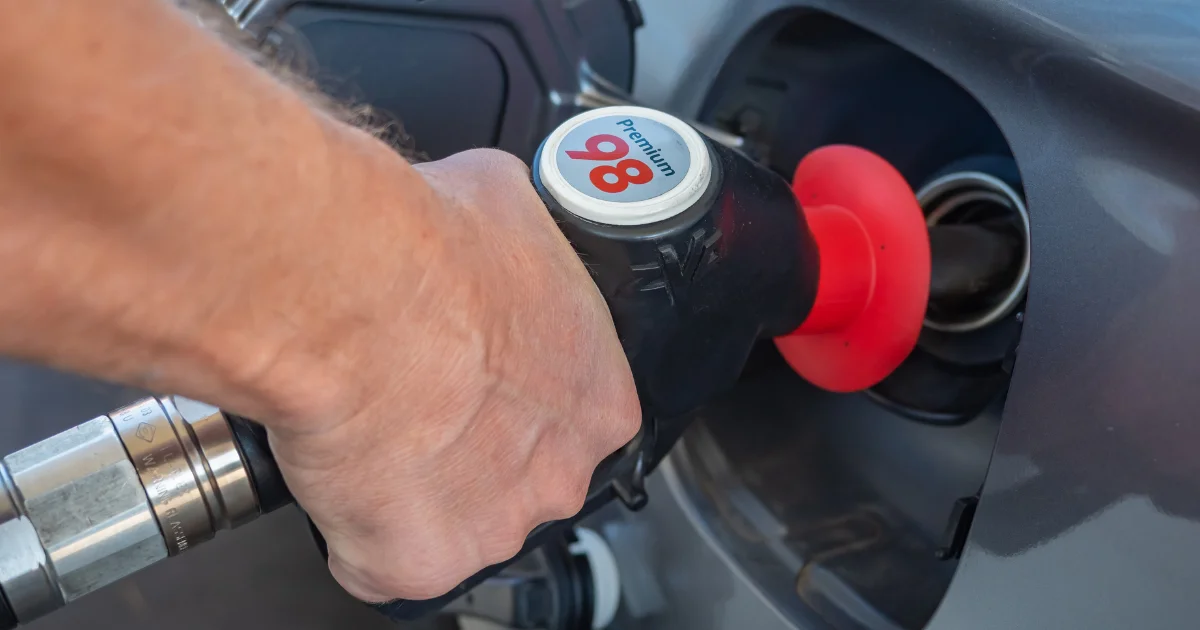
Fuel has come back down — for now
A Middle East oil shock spiked prices in March 2026. They've since eased back to around pre-conflict levels, helped by a temporary cut to the fuel excise.
per litre, unleaded
Approximate national average in June 2026. The five-largest-city average was 173.3c/L in early June, down sharply from the March peak.
per litre of excise relief
The temporary fuel excise reduction that has been holding pump prices down took effect on 1 April 2026.
Shifts on 1 July 2026. The temporary excise relief is scheduled to end on 30 June 2026, so pump prices are likely to tick back up from early July.
Sources: ACCC — Weekly fuel price monitoring · Australian Institute of Petroleum — Pricing
Electricity is the standout climber
With Commonwealth and state rebates wound back, household electricity prices jumped over the past year. A typical annual bill runs from roughly $1,400 to $2,300 depending on your state, network and usage.
Shifts on 1 July 2026. The new Default Market Offer lowers regulated standing-offer prices by 3.4–5.0% in NSW and 7.2% in South East Queensland, while South Australia rises 1.4%.
Sources: ABS — CPI, April 2026 · AER — Default Market Offer 2025–26 · AER — Default Market Offer 2026–27
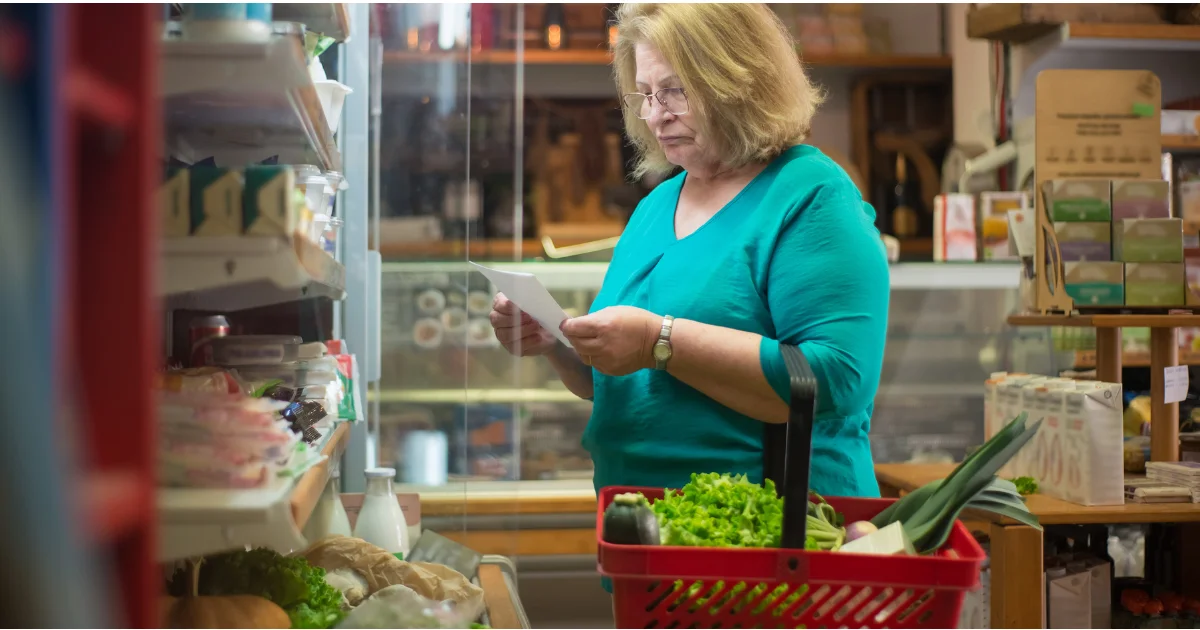
Groceries keep grinding higher
Food inflation has cooled from its peak but prices keep rising off an already-high base. Consumer surveys put the typical weekly shop in this range (these are survey estimates, not an official figure).
typical weekly grocery shop
National averages from Canstar Blue (2025) and Finder (2026) consumer surveys. Your bill varies with household size and where you live.
food inflation, year to April
The official ABS measure of food and non-alcoholic beverage price growth — with meat among the biggest movers.
Sources: Canstar Blue — Average grocery bill · Finder — Average grocery bill · ABS — CPI, April 2026
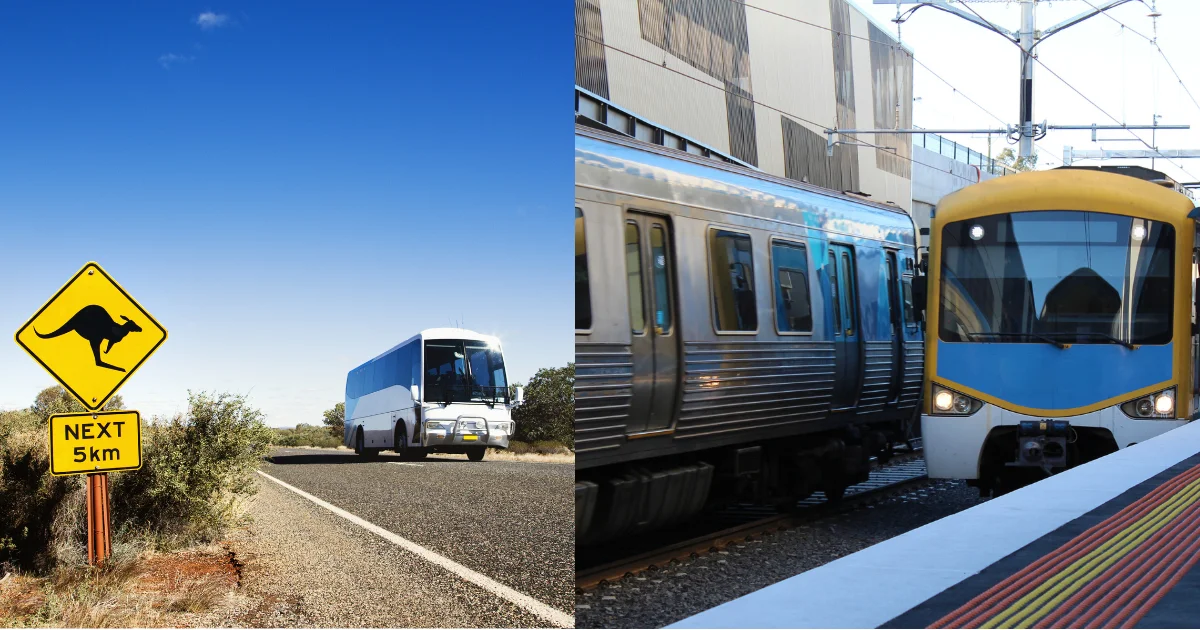
Childcare and transport round out the budget
per hour — centre-based day care
National average before the Child Care Subsidy (Dec quarter 2025). The ACT is highest at $16.10/hr. From January 2026, the 3 Day Guarantee gives eligible families at least 72 subsidised hours a fortnight.
of income on transport
What a typical capital-city household spends getting around — fuel, car loans, rego, insurance and public transport combined. Hobart and Launceston households spend the most.
Sources: Australian Government Department of Education — Child Care Subsidy data, Dec quarter 2025 · Australian Automobile Association — Transport Affordability Index
Sources
Each figure above comes from a published, reputable Australian source. Click through to the original.
Method note: figures are a snapshot as at June 2026. Two will change from 1 July 2026 — household electricity prices (new AER Default Market Offer) and fuel (the temporary excise relief ends 30 June). Grocery figures are consumer-survey estimates rather than an official statistic; the official anchor for food prices is the ABS CPI. Electricity bills vary by state, network and usage, and the AER Default Market Offer applies only in NSW, South East Queensland and South Australia.
Cost of Living in Australia: A 2026 Snapshot of Rent, Energy, Fuel, Groceries and More
Original Publish Date: May 19, 2023 | Updated as of June 23, 2026
Disclaimer: This article is general information only and is intended for educational purposes. It does not take into account your personal objectives, financial situation or needs, and does not constitute financial, credit or professional advice. Friendly Finance is a loan-matching and comparison service, not a lender. Before acting on any information here, consider whether it is appropriate for your circumstances and seek independent advice from a licensed professional where needed.
Key Takeaways:
Inflation has eased to 4.2% (year to April 2026), but housing, transport and electricity are still the fastest-rising essentials.
Rent is the biggest squeeze: median weekly asking rents range from $590 in Adelaide and Melbourne to $800 in Sydney, and renters now spend a record ~33.1% of income on housing.
Electricity is up about 22.5% over the year; from 1 July 2026 regulated prices fall in NSW and South East Queensland but rise slightly in South Australia.
Petrol has eased back to roughly $1.70 a litre, but the temporary fuel excise relief ends 30 June 2026, so prices may climb again.
Childcare averages $14.40 an hour before subsidy (highest in the ACT), and a typical household spends about 15.8% of income on transport.
How Much Does It Cost To Live In Australia In 2026?
Australia is a vast country, and the cost of living varies widely depending on where you live. Understanding what everyday essentials actually cost — rent, power, fuel, groceries, childcare and getting around — is the starting point for any realistic budget, whether you are moving interstate, starting out, or simply trying to stay ahead of rising prices.
This is a snapshot of where prices sit as at June 2026, drawn only from published, reputable Australian sources. Two figures are about to move: household electricity prices and fuel both change from 1 July 2026, and we have flagged those shifts in the relevant sections below.
How The Cost Of Living Is Measured
The cost of living refers to the amount of money needed to cover basic expenses such as housing, food, transport and energy in a particular place. In Australia, the headline measure is the Consumer Price Index (CPI), published by the Australian Bureau of Statistics (ABS), which tracks the average change in prices for a basket of goods and services bought by households. The ABS also publishes Selected Living Cost Indexes, which measure price changes for different household types, and the Household Spending Indicator, which shows where households are actually spending.
Costs vary by location, household size and lifestyle, so the figures below are best read as benchmarks rather than a precise prediction of any one household's budget.
What Is Driving Costs in 2026
Annual inflation was 4.2% in the 12 months to April 2026, easing from 4.6% in March. Underlying (trimmed mean) inflation was 3.4%. The largest contributors to annual inflation were housing (+6.3%), transport (+6.6%) and food and non-alcoholic beverages (+2.8%). The standout mover was electricity, with prices about 22.5% higher than a year earlier as Commonwealth and state rebates were wound back.
Source: Australian Bureau of Statistics — Consumer Price Index, April 2026
Rent: The Biggest Line In The Budget

Rent is the single largest expense for most households, and it remains under pressure. The table below shows median weekly asking rents across all eight capital cities for the March 2026 quarter. Sydney is the most expensive in the country; Adelaide and Melbourne are the most affordable of the mainland capitals.
Capital city | House (median/wk) | Unit (median/wk) |
Sydney (NSW) | $800 | $750 |
Perth (WA) | $740 | $695 |
Darwin (NT) | $720 | $600 |
Canberra (ACT) | $700 | $580 |
Brisbane (QLD) | $680 | $660 |
Hobart (TAS) | $620 | $500 |
Adelaide (SA) | $590 | $550 |
Melbourne (VIC) | $590 | $600 |
The pressure is not just in the headline numbers. Nationally, renters are now committing an estimated 33.1% of gross household income to rent — the highest share on record — with rents up about 5.7% over the year and vacancy rates still very tight across the capitals.
Source: Domain Rental Report, March 2026 quarter · Cotality (CoreLogic) Rental Review, Q1 2026
Electricity And Energy
Electricity has been the fastest-rising major household cost over the past year, up about 22.5% as rebates ended. A typical annual electricity bill runs from roughly $1,400 to $2,300 depending on your state, distribution network and usage. As a regulated benchmark, the Australian Energy Regulator's Default Market Offer reference price for representative usage is about $1,965 a year in Sydney and around $2,301 in Adelaide — though the Default Market Offer applies only in New South Wales, South East Queensland and South Australia. Victoria, the ACT, Tasmania, the Northern Territory, regional Queensland and Western Australia are covered by separate regulators.
Shifts on 1 July 2026: the new Default Market Offer lowers regulated standing-offer prices by between 3.4% and 5.0% in New South Wales and by 7.2% in South East Queensland, while South Australia sees a small rise of 1.4%. It always pays to compare offers — most market plans sit below the Default Market Offer.
Source: ABS CPI (electricity) · AER Default Market Offer 2025–26 · AER Default Market Offer 2026–27
Fuel And Petrol
Petrol prices spiked in March 2026 following a Middle East oil shock, then eased back to around pre-conflict levels by mid-June. The national average for unleaded was roughly $1.70 a litre in June 2026 (the five-largest-city average was about 173.3 cents a litre in early June, down sharply from the March peak). A key reason prices fell back is a temporary cut to the fuel excise of around 32 cents a litre, in effect from 1 April 2026.
Shifts on 1 July 2026: the temporary excise relief is scheduled to end on 30 June 2026, so pump prices are likely to rise again from early July. Using your state's fuel-price app (such as FuelCheck in NSW or FuelWatch in WA) and filling up at the low point of your local price cycle can save meaningfully per tank.
Source: ACCC — Weekly fuel price monitoring · Australian Institute of Petroleum — Pricing
Groceries
Food inflation has cooled from its peak but prices continue to rise off an already-high base — food and non-alcoholic beverages were up 2.8% over the year to April 2026, with meat among the biggest movers. Consumer surveys put the typical weekly grocery shop at roughly $178 to $207 nationally; these are survey estimates rather than an official statistic, and your bill will vary with household size and location. Shoppers are increasingly leaning on specials, loyalty programs and supermarket-own brands to manage costs.
Source: Canstar Blue — Average grocery bill · Finder — Average grocery bill · ABS CPI (food)
Childcare

For families with young children, childcare is one of the largest recurring costs. Centre-based day care averaged $14.40 an hour nationally before the Child Care Subsidy in the December quarter 2025 — roughly $144 for a 10-hour day. The Australian Capital Territory is the most expensive at $16.10 an hour, with inner Sydney, Melbourne and Canberra typically well above the national average. From 5 January 2026, the new 3 Day Guarantee gives eligible families a minimum of 72 subsidised hours a fortnight (about three days a week), and the Child Care Subsidy can cover up to 90% of fees depending on household income.
Transport And Getting Around
Beyond fuel, the full cost of getting around — car loan repayments, registration, insurance, servicing, tolls and public transport — adds up to a significant share of the household budget. A typical capital-city household spends about 15.8% of its income on transport, according to the Australian Automobile Association, with Hobart and Launceston households spending the largest share and Brisbane among the lowest (helped by its 50-cent public transport fares).
Source: Australian Automobile Association — Transport Affordability Index
Managing Rising Costs
If cost-of-living pressure is becoming hard to manage, there are free options worth using before taking on new debt:
Talk to a free, independent financial counsellor on the National Debt Helpline (1800 007 007).
Contact your electricity, gas, phone or water provider to ask about a payment plan or hardship support.
Compare energy plans on the government's Energy Made Easy website, and check fuel-price apps before filling up.
Visit the government's MoneySmart website for budgeting tools and guidance on how small-amount loans work.
Sources